Create Forecast
The Create Forecast screen is used to set up and execute new inventory forecasts based on the criteria throughout the four tabs of the screen.
Menu Path: Inventory, Forecasting Dashboard, Forecasting Dashboard screen, 'Create New Forecast' button.
If you are operating in a single-location environment, the 'Forecast Criteria' tab displays.
If you are operating in a multi-location environment, the 'Locations' tab displays.
Function Buttons
Each tab has the same function buttons on the right-hand side of the screen.
Close
Click to close the Create Forecast screen. Returns to the Forecasting Dashboard screen.
Reset
Click to reset all criteria on ALL tabs in the screen, as if the screen was just opened.
Profile
Click to open the 'Profiles' pop-up, where previously saved inventory forecast profiles display. The option to save a new profile is also available.
Note: A profile must be created before creating a forecast to ensure forecast configuration settings are maintained.
Note: When a forecast profile is saved or loaded on the screen, the name of the forecast profile is displayed in the top-left corner of the screen. If any changes are made on the screen, the name is removed (to reflect it is no longer following the forecast profile's setups.)
Forecast
Click to create a forecast based on the setup information defined in all tabs.
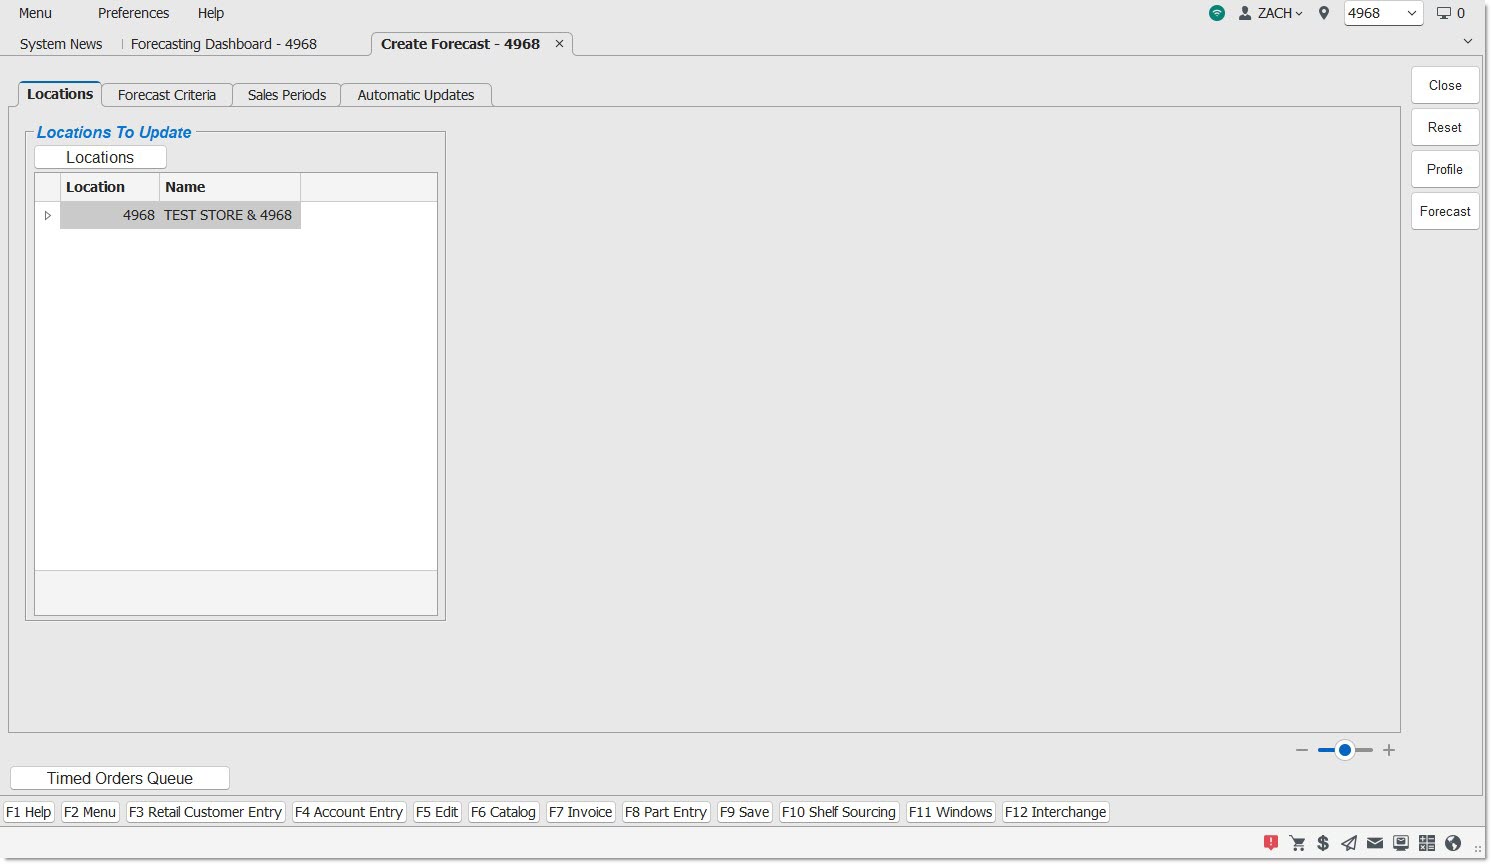
Locations Tab
The 'Locations' tab is used to select the location(s) used to create a forecast. Note: The 'Locations' tab is the tab that appears first for multi-location environments.
Menu Path: Inventory, Forecasting Dashboard, Forecasting Dashboard screen, 'Create New Forecast' button, 'Locations' tab
Locations
Click to open the 'Browse Locations' pop-up to select which locations the forecast is being run for.
The 'Browse Locations' pop-up only shows locations assigned as per the Store Group of the Employee Security Setup.
All locations selected are included in the forecast.
To remove a location from the list, re-open the 'Browse Locations' pop-up and deselect it from the list.
Locations to Update Grid
Displays the current location (as the default) which cannot be removed from the grid.
A footer displays underneath the grid to indicate the total number of locations involved in the forecast.
Location
Displays the location number of the selected location(s).
Name
Displays the location name of the selected location(s).
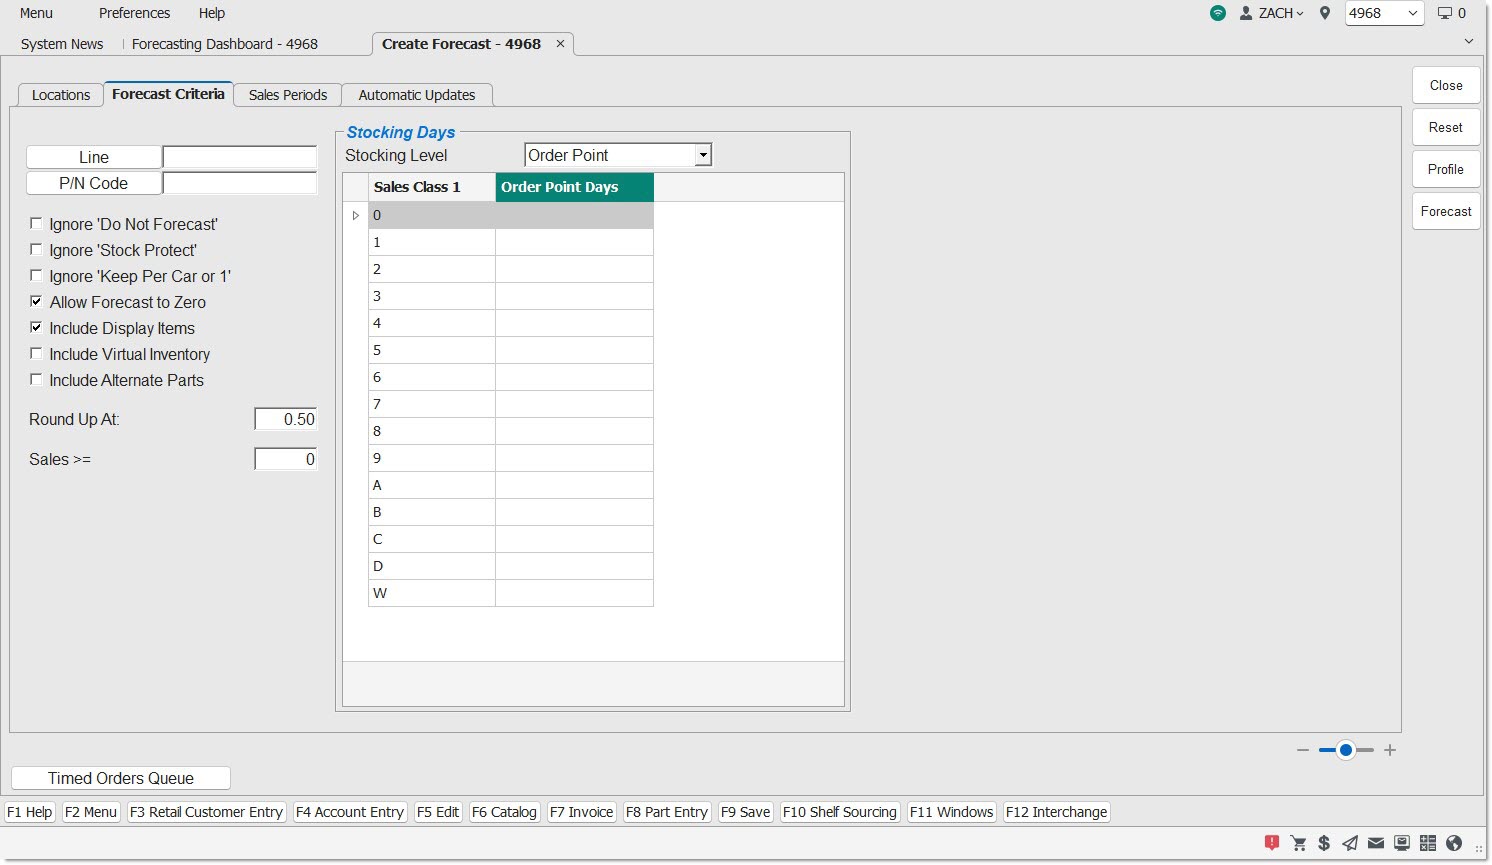
Forecast Criteria Tab
The 'Forecast Criteria' tab is used to select one or more Lines and PN Codes (Sublines) to include in the forecast. It is also used to select a few options used during the forecast calculations (e.g. Ignore 'Stock Protect'.) Furthermore, it is also used to define the stocking level days per 'Sales Class 1'.
Menu Path: Inventory, Forecasting Dashboard, Forecasting Dashboard screen, 'Create New Forecast' button, 'Forecast Criteria' tab
Line
Click to open the 'Browse Line Codes' window to add specific lines to the inventory forecast. The forecasting routine only processes those part items that match the entered values in the 'Line' and 'P/N Code' fields when calculating stocking levels.
Note: The system will impose a limit of up to 100 line codes included within a forecast.
When the 'OK' button is clicked on the Line Codes pop-up, the application validates that the number of selected line codes is 100 or less. If the 100 limit is exceeded, the 'Browse Line Codes' pop-up does not close, and instead the application displays a prompt pop-up with the text: "You must select 100 line codes or less."
P/N Code
Click to open the 'Browse P/N Codes' window to add specific P/N Codes (sublines) to the inventory forecast. The forecasting routine only processes those part items that match the entered values in the 'Line' and 'P/N Code' fields when calculating stocking levels.
Ignore 'Do Not Forecast'
Checkbox that overrides the 'Do Not Forecast' setting on inventory screens.
-
Checked – The forecasting routine will include part items where the 'Do Not Forecast' (Order / Cost screen) checkbox is checked.
-
Unchecked – The forecasting routine will ignore part items where the 'Do Not Forecast' flag is checked.
Ignore 'Stock Protect'
Checkbox that overrides the 'Stock Protect' setting on inventory screens.
-
Checked – The forecasting routine will ignore the 'Stock Protect' checkbox (Part Entry screen, Order / Cost screen, and Part Pricing screen) and perform the stocking level calculations.
-
Unchecked – the forecasting routine includes items in the forecast where the 'Stock Protect' flag is checked, but maintains the stocking level by copying the current stocking level value to the forecasted value (and does not calculate a suggested new stocking level value based on sales history and other criteria).
Important Note: The suggested stocking level value can be edited in an open forecast, regardless if the 'Ignore 'Stock Protect'' setting is checked or unchecked. However, the 'Stock Protect' flag setting on the Part Entry, Order / Cost, or Part Pricing screens, will not be altered when a forecast is edited.
Ignore 'Keep Per Car or 1'
Checkbox that overrides the 'Keep Per Car or 1' setting on inventory screens.
-
Checked – (And the 'Keep Per Car Or 1' checkbox is checked on the Order / Cost screen), the forecasting routine ignores the 'Keep Per Car Or 1' setting, and instead calculates a suggested stocking value based upon sales history and other criteria. This may result in a suggested stocking level value different than the 'Per Car' value on the Part Entry or Order / Cost screens.
-
Unchecked - (And the 'Keep Per Car Or 1' checkbox is checked on the Order / Cost screen), and if sales history supports a suggested stocking level less than the 'Per Car' value, the forecasting routine will always suggest a stocking level value equal to the 'Per Car' value (on the Part Entry or Order / Cost screen). Important Note: If the 'Per Car' value is zero, the forecasting routine will set the suggested stocking level to a value of 1 (and not zero), unless other forecast criteria are defined.
-
Checked – The forecasting routine does not prevent a forecast stocking level suggestion of zero (for Min, Max, or Order Point).
-
Unchecked – The forecasting routine always suggests a minimum forecast stocking level of 1, (unless the stocking days for 'Sales Class 1' is zero).
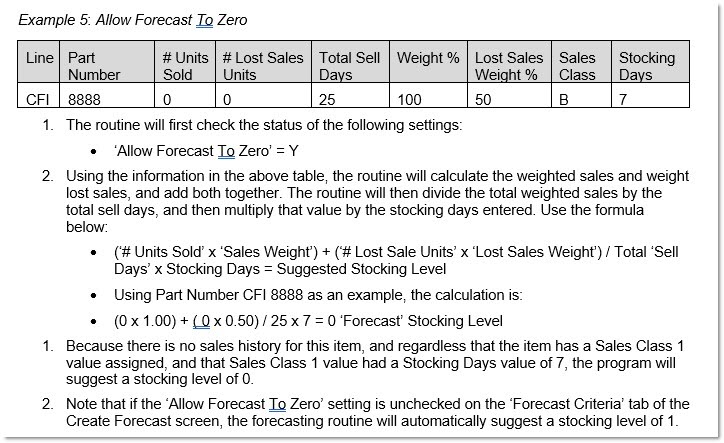
Important Note: When the forecasting routine detects that there is no sales history, or that the sales history is small enough such that a forecast stocking level suggestion of zero would result, the program will always still suggest a forecast stocking level of 1, unless the 'Allow Forecast To Zero' setting is checked.
Include Display Items
Checkbox that overrides the 'Display Label Qty' setting on inventory screens.
-
Checked - The forecasting routine includes items for the forecast regardless of the 'Display Label Qty' value (on the Order / Cost or Part Pricing screens).
-
Unchecked - The forecasting routine excludes items where the value of the 'Display Label Qty' is greater than zero (on the Order / Cost or Part Pricing screens).
-
Checked - the forecasting routine checks for parts that match the Line, P/N Code and Sales Class criteria in both the location(s)' inventory (parts table) as well as the location's virtual inventory (non-SKU table), and includes those items in the forecast.
-
Unchecked - The forecasting routine only checks for parts that match the Line, P/N Code and Sales Class criteria in the location(s) inventory (parts table) running the forecast, and includes those items in the forecast.
Important Note: The location's inventory will include both stocked parts (those with a Min, Max, or Order Point non-zero value) as well as non-stocked parts (that have a Min, Max, or Order Point zero value but were sold or purchased and can have a Quantity Available greater than or now equal to zero).
-
Checked - Any part(s) set up as alternates (on the Part Association screen) for parts included in the forecast, at the time the forecasting routine is started, are logged.
-
Unchecked - Any part(s) set up as alternates for parts included in the forecast, at the time the forecasting routine is started, are not displayed on the Forecast Detail screen.
Round Up At:
Define the value the forecasting routine will round the stocking level up. For example, if the 'Round Up At:' field contains a value of 0.75, and a suggested stocking level of 3.67 is calculated, the forecasting routine will round that value down to 3. If a suggested stocking level of 3.75 is calculated, the forecasting routine will round that value up to 4. The default value is 0.50, but values from 0.01 to 0.99 are allowed.
Sales >=
Enter any numeric value between 0 and 999999.
When a value greater than zero is entered, the application compares the 'Sales >=' value to the total # Units Sold for any part where the 'Stocking Days' is set to zero for any 'Sales Class 1' value.
If the total # Units Sold for any part for that Sales Class 1 is equal to or greater the 'Sales >=' value, the forecasting routine will suggest a stocking level equal to the 'Per Car' value or 1.
If the total # Units Sold for any part for that Sales Class 1 is less than the 'Sales >=' value, the forecasting routine will suggest a stocking level of zero (because the 'Stocking Days' was set to zero).
Note: This comparison only applies to # Units Sold and not # Lost Sales Units.
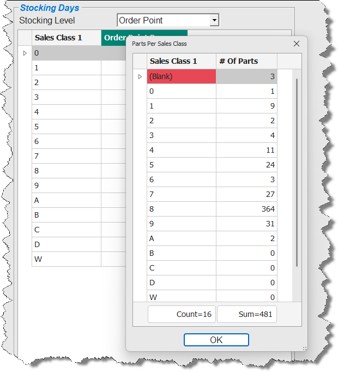
Part Count By Sales Class
Note: This button is not enabled until a 'Line' has been selected.
Click to display the 'Parts Per Sales Class' window.

Stocking Days Section
Drop-down that represents the stocking level that is calculated within the forecasting routine. Options are 'Min', 'Max', or 'Order Point'. The name of the column in the grid is dependent on the 'Stocking Level' drop-down.
Sales Class 1
Displays all system-seeded 'Sales Class 1' values. Note: It is not possible to edit/remove any 'Sales Class 1' values from the 'Stocking Days' grid.
Days
Displays the selected stocking level 'Days' in the column header. The name of the column in the grid is dependent on the 'Stocking Level' drop-down.
After the forecasting routine has applied a filter to determine which part items to forecast based upon Locations, Lines, PN Codes selected, as well as the additional forecast criteria options, the routine will then filter part items further based upon stocking days per sales class entered.
When a 'Days' value is left blank (cell = Null), the forecasting routine excludes part items from the forecast that currently are assigned to that 'Sales Class 1' value. Important Note: Any part item in the store inventory or virtual inventory that is not currently assigned to any 'Sales Class 1' value is not included in the forecasting routine.
When a value of zero is entered, the forecasting routine creates a suggested stocking level of zero for items that have that 'Sales Class 1' value assigned value on the Part Entry, Order / Cost, or Part Pricing screens. Important Note: This is the only method that can be used to force suggested stocking levels to zero (regardless of whether part items have any sales or lost sales history units).
When a non-zero value is entered in the stocking level 'Days' column for a 'Sales Class 1' code, the forecasting routine creates a suggested stocking level for part items that have that 'Sales Class 1' value assigned on the Part Entry, Order / Cost, or Part Pricing screens.
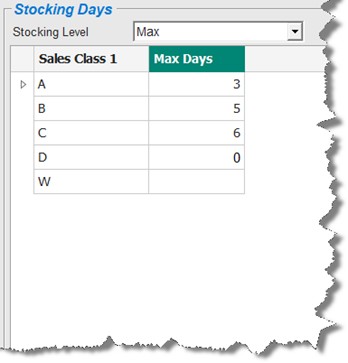
In the sample excerpt screen above, for example:
-
The Stocking Level of 'Max' is selected, and non-zero values have been entered in the 'Max Days' column for 'Sales Class 1' codes 'A', 'B', and 'C'. Since a non-zero value has been entered for these codes, the forecasting routine will calculate a suggested stocking level (based on the amount of stocking days entered) for part items which have any of these 'Sales Class 1' values assigned. Important Note: If the 'Allow Forecast To Zero' setting is unchecked, the minimum stocking level suggested will be 1, regardless if a part item has sales (or lost sales) history units for the selected period(s) or if the 'Keep Per Car Or 1' part setting is checked or unchecked.
-
Since a value of zero is entered for 'Sales Class 1' code 'D', the forecasting routine will create a suggested stocking level of zero for any part items in the forecast with a 'Sales Class 1' code of 'D' assigned that have no sales or lost sales history.
-
'Sales Class 1' code 'W' has a Null value, so the forecasting routine will exclude any part items with this 'Sales Class 1' values from the forecast.
You can change the stocking level default displayed in the drop-down. For example:
-
If the 'Order Point Days' Stocking Level is selected, the 'Max' column will be replaced with a 'Order Point Days' column and the grid will remove all of the numbers previously entered in the 'Max Days' column.
-
If you change the Stocking Level back to 'Max Days', the grid will remove all of the numbers previously entered in the 'Order Point Days' column, and will not re-display previously entered 'Max Days' numbers. All 'Max Day' numbers will need to be re-entered for all 'Sales Class 1' codes desired in the forecast.
Sales Periods Tab
Menu Path: Inventory, Forecasting Dashboard, Forecasting Dashboard screen, 'Create New Forecast' button, 'Sales Periods' tab
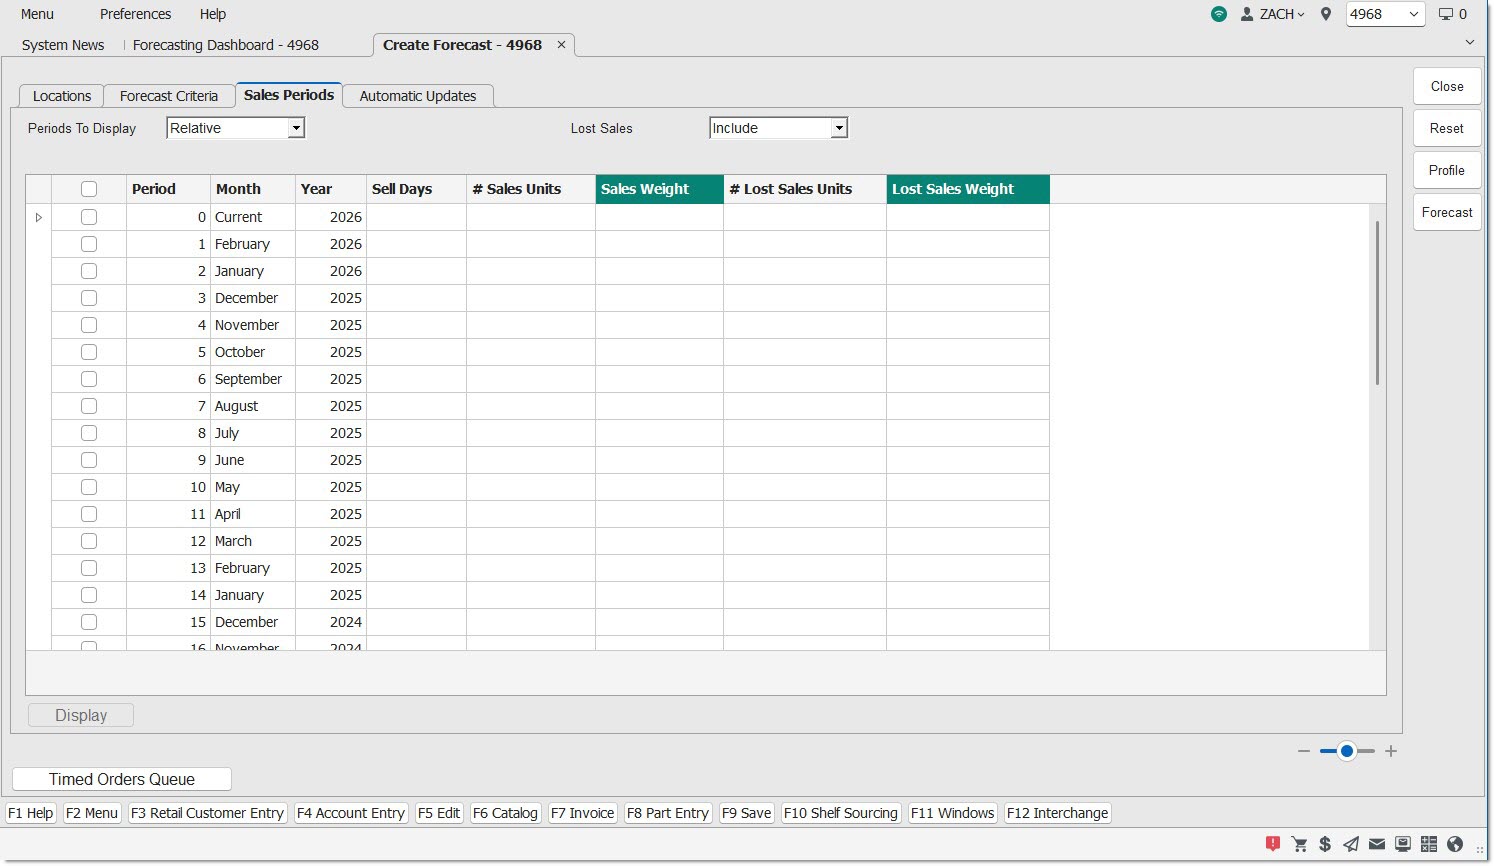
When the screen is first opened, the 'Periods to Display' and 'Lost Sales' default selections are obtained from the 'Forecasts' tab of the Store General Setup screen.
Periods to Display
Drop-down that determines which periods to display in the grid. Options are:
-
'Actual' – Displays only 12 rows with the calendar months. All periods will default to unchecked.
-
'Relative' – Displays each monthly sales period by calendar year in descending order, starting at the top with the current sales period, and then displaying the monthly sales periods for three previous full years back. Note: Since these are “relative” periods, they will move or roll forward when the screen is reopened each month to the new current period.
-
'Rolling 6' – Displays the current period plus the 6 previous periods. Pre-select and disable the checkboxes for periods 1 through 6, while the current period is unselected and enabled for selection.
-
'Rolling 12' – Displays the current period plus the 12 previous periods. Pre-select and disable the checkboxes for periods 1 through 12.
-
'Rolling 24' – Displays the current period plus the 24 previous periods. Pre-select and disable the checkboxes for periods 1 through 24.
-
'Rolling 36' – Displays the current period plus the 36 previous periods. Pre-select and disable the checkboxes for periods 1 through 36.
For all of the above 'Rolling...' options, the 'Current' period displays at the top of the grid, and be unchecked by default. The option to include the 'Current' period using the checkbox is available.
Important Note: The usage of 'Relative' and 'Rolling' periods enables forecasts to be scheduled without having to manually update calendar months each time the forecast is run.
When 'Actual' is selected, underneath the 'Periods to Display' drop-down five checkboxes display. At least one of these checkboxes must be checked before selecting any of the 12 rows in the PW Grid.
-
'Current Period To Date' - After selecting this option, the forecasting routine includes the current period, when selected in the grid.
-
If the 'Current Period To Date' setting is checked, then the application automatically checks the 'Current Year' setting.
-
If the 'Current Year' setting is unchecked then the application automatically unchecks the 'Current Period To Date', setting.
-
-
'Current Year' - After selecting this option, the forecasting routine includes any selected period for the current year.
-
'1st Prior Year' - After selecting this option, the forecasting routine includes any selected period for the previous year.
-
'2nd Prior Year' - After selecting this option, the forecasting routine includes any selected period for the second previous year.
-
'3rd Prior Year' - After selecting this option, the forecasting routine includes any selected period for the third previous year.
The above checkboxes are hidden when any other selection in the 'Periods To Display' drop-down is made (e.g. 'Relative', 'Rolling 6', 'Rolling 12', 'Rolling 24' or 'Rolling 36').
Because years are selected using the above checkboxes, the PW Grid does not display the 'Year'.
If you attempt to click a period in the grid before selecting a checkbox above the grid, the application displays a prompt pop-up with the text: “Please select a year.” The application then unchecks the checkbox selected in the grid. At least one checkbox above the grid and one checkbox in the grid must be selected to create a forecast.
Important Note: The usage of 'Actual' periods enables forecasts to be scheduled using the same calendar months each time the forecast is run. These months are not 'relative' or 'rolling'.
Drop-down that determines whether or not the lost sales items are included as weight in the forecast. Options are:
-
'Include' - When selected, the forecasting routine includes part item's lost sales history units (in addition to sales history units) to calculate a suggested stocking level.
-
'Exclude' - When selected, the forecasting routine excludes lost sales history units (and only uses sales history units) to calculate a suggested stocking level.
When the 'Display' button is clicked to populate the grid, both the '# of Lost Sales Units' and the 'Lost Sales Weight' are not populated with any values.
The 'Lost Sales Weight' is not editable.
Sales Periods Tabs Grid
Period
Displays the forecasting period. On the Close Schedule Setup screen, if the Close Type is set to 'Calendar' then the Period numbers are 1 - 12 (because the calendar months are January - December).
Month
Displays the month associated with the period.
Year
Displays the year associated with the month for the period.
Sell Days
Displays the number of days in the period. The column in the grid begins with the maximum number of days per calendar month (e.g. 31 for January and 28 or 29 for February), and then will be further reduced based upon optional non-working days (e.g. weekends, holidays, or planned closures) entered on the Store Work Schedule screen. Note: When 'Periods To Display' is set to 'Actual', the 'Sell Days' value aggregates based on the amount of years selected for each month.
# Sales Unit
The '# Sales Unit' for each period will be aggregated for all part items within the 'Line' and 'P/N Code' settings selected on the 'Forecast Criteria' tab (regardless of the part item's 'Sales Class 1' value). Important Note: Transfer sales will be excluded from the '# Sales Units' and if the 'Update Transfer Histories' setting is unchecked (on the Store Invoice Options screen, 'Standard' tab).
Sales Weight
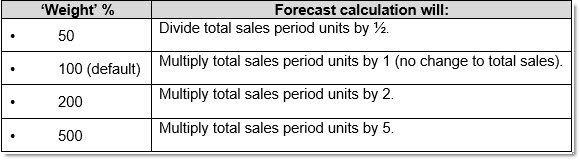
Editable column that enables you to change the “weight” of the sales to determine their importance in the forecast.
- Note: This setting can be edited to account for seasonality or other factors.
- This value can be changed to any value within the range of 0 through 999. This percentage represents the significance for the sales units within each period used for the forecast calculation.
- Below is an example (using only sales) of an entered weight percentage, and how the forecasting routine will apply that weight.
The '# Lost Sales Unit' for each period will be aggregated for all part items within the 'Line' and 'P/N Code' settings selected on the 'Forecast Criteria' tab (regardless of the part item's 'Sales Class 1' value). Important Note: Transfer sales will be excluded from the '# Lost Sales Units' and if the 'Update Transfer Histories' setting is unchecked (on the Store Invoice Options screen, 'Standard' tab).
Lost Sales Weight
Editable column that enables you to change the “weight” of the lost sales to determine their importance in the forecast.
If the 'Lost Sales' drop-down is set to 'Include', the 'Lost Sales Weight' column values are also editable, and defaulted to a value of 100 (percent).
-
Note: This setting can be edited to account for seasonality or other factors.
-
This value can be changed to any value within the range of 0 through 999. This percentage represents the significance for the optional lost sales units within each period used for the forecast calculation
Display
Click to populate the grid once any sales period checkboxes have been checked.
If any of the period(s) in the grid are checked, and then the 'Display' button is clicked, only the rows in the grid that were just selected are populated.
If any of the period(s) in the grid are unchecked, and then the 'Display' button is clicked, all values in those rows only are cleared. The values in the period(s) that remain selected in the grid are maintained.
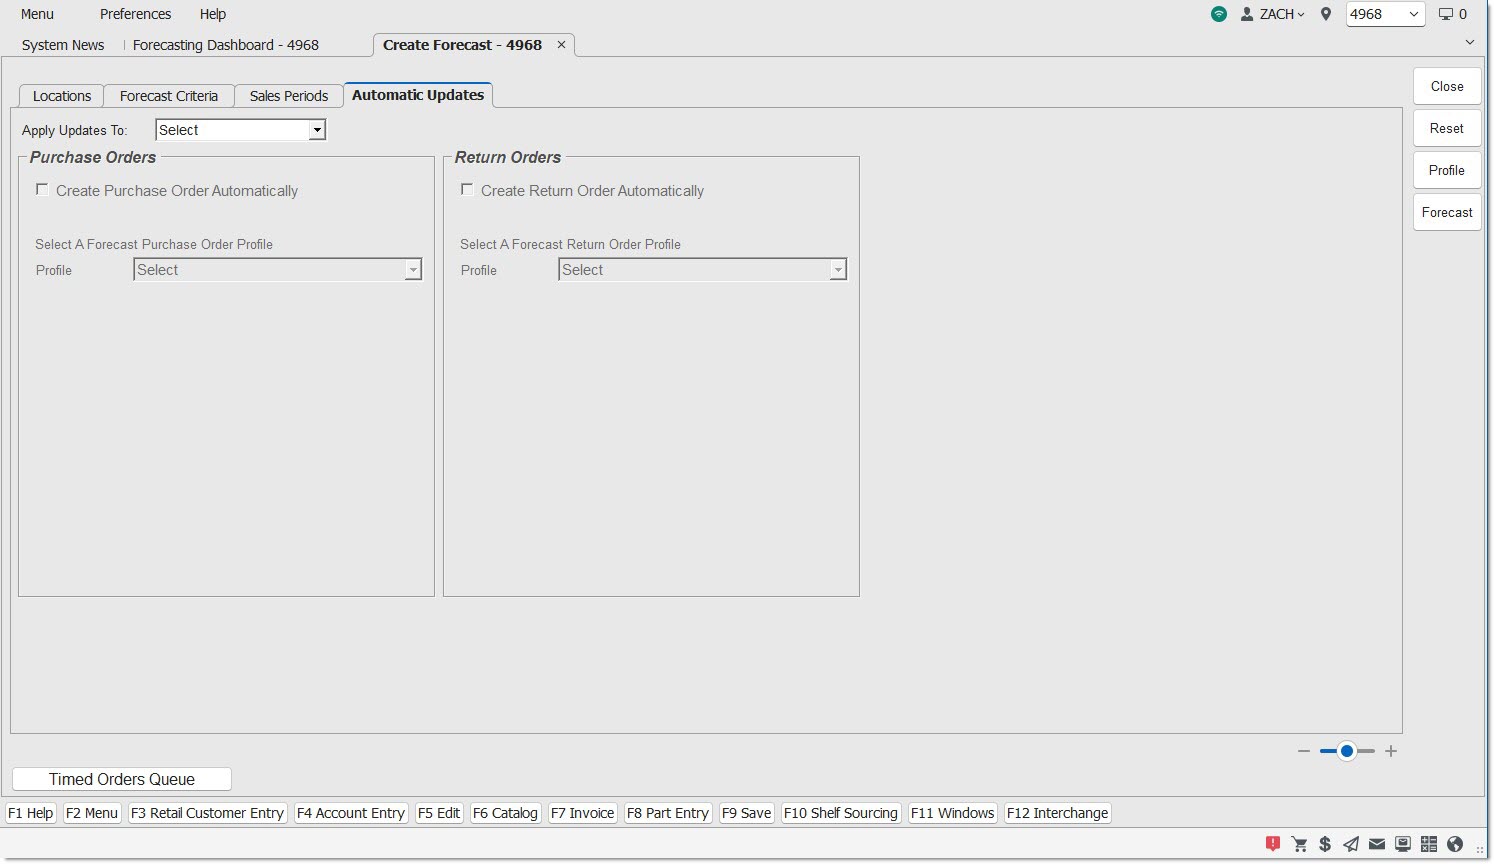
Automatic Updates Tab
The 'Automatic Updates' tab contains optional rules to specify what occurs after the forecasting routine has calculated new suggested stocking levels, with a default of no automatic updates.
Menu Path: Inventory, Forecasting Dashboard, Forecasting Dashboard screen, 'Create New Forecast' button, 'Automatic Updates' tab
The settings in the 'Automatic Updates' tab are disabled when more than one location has been selected in the 'Locations' tab.
Applying Automatic Updates
Drop-down menu defines what updates the forecasting routine automatically applies. Options are:
-
'Select (default)'
-
'All Changes':
-
Update all 'Current' stocking levels for all part items in the forecast to the 'New' values.
-
-
'All Changes To 0':
-
Only update those part items where the forecast calculated a stocking level change from a value greater than 0 to 0.
-
-
'All Changes From 0':
-
Only update those part items where the forecast calculated a stocking level change from a value of 0 to a value greater than 0.
-
-
'All Increases':
-
Only update those part items where the forecast calculated an increase to a stocking level (greater than the current stocking level).
-
-
'All Decreases':
-
Only update those part items where the forecast calculated a decrease to a stocking level (less than the current stocking level).
-
Note: If a forecast contains only one type of change, and that change is selected in the 'Apply Updates To' drop-down, the forecasting routine moves the forecast from the 'Open Forecasts' tab to the 'Historical Forecasts' tab. For example, if a forecast has only 'Increases', and the 'Apply Updates To' drop-down is set to 'All Increases', move the forecast from the 'Open Forecasts' tab to the 'Historical Forecasts' tab as the only changes are increases.
For any part included in the forecast, the 'Last Forecast Run Date' (on the Order / Cost screen) populates with the forecast create date for any parts included in the forecast (excluding virtual inventory).
For any part updated where the stocking level is changed to a value different than the 'Current' stocking level value, the 'Last Forecast Change Date' field populates on the Order / Cost screen.
When any value other than the default 'Select' is selected, after the forecast is created:
-
Stocking level updates to 'Min', 'Max', or 'Order Point' on the Part Entry screen are automatically applied to all forecasted part items as per the 'Apply Updates To' selection.
-
The forecast is viewable on the Forecasting Dashboard under the 'Historical Forecasts' tab, if:
-
The 'Apply Updates To' drop-down selection matches the change to stocking levels in the forecast. For example, the 'All Increases' option was selected, and the forecast contains only increases.
-
The 'All Changes' option is selected.
-
-
The forecast is viewable on the Forecasting Dashboard under the 'Open Forecasts' if:
-
The forecast contains only one change to stocking levels, and the 'Apply Updates To' drop-down selection does not match the change. For example, the 'All Increases' option was selected, but the forecast contains only decreases.
-
The forecast contains more than one change to stocking levels, and the 'All Changes' option is not selected. For example, the forecast contains increase and decreases.
-
Automatic Creation of Purchase Orders
If the 'Apply Updates To:' drop-down value is changed from the default 'Select' to any other value (e.g. 'All Changes'), both of the disabled 'Create Purchase Order Automatically' and 'Create Return Order Automatically' checkboxes are enabled.
If the 'Apply Updates To:' drop-down value is changed back to the default 'Select', the tab is refreshed and all other selections made are removed.
When the 'Create Purchase Order Automatically' checkbox is checked, the disabled 'Profile' drop-down below the checkbox is enabled.
When the 'Create Return Order Automatically' checkbox is checked, the disabled 'Profile' drop-down below the checkbox is enabled.
When a drop-down of existing purchase or return order profiles are displayed, only include order profiles where 'Select Mode' = 'Forecast Adjust Purchase' or 'Forecast Adjust Return' and 'Order Method' = 'IVT Forecast'.
The forecasting routine queues the PO process when an order profile is selected.
The supplier and user-defined settings saved within the purchase order or return order profile are used to create the order(s).
The created order(s) can be found on the Purchasing Dashboard screen.
- The status of the orders is 'Fin', regardless if the 'Finalize Immediately' setting is checked or unchecked (on the Create Purchase Order screen).
If any order profile(s) have been selected, and either the 'Create Purchase Order Automatically' or the 'Create Return Order Automatically' checkboxes are unchecked, the appropriately selected profile(s) are removed, and the order is not automatically created.
Forecast Profiles
Forecast profile are loaded, saved, and deleted on the Create Forecast screen.
A forecast profile must be saved before creating a forecast. If the 'Forecast' button is clicked before there is a saved profile, the prompt pop-up below displays:
Click the 'Profile' button to show the 'Profiles' pop-up.
The pop-up displays two columns, 'Private?' and 'Profile Name', with an empty list before any profiles are saved.
Private?
If the profile is saved with the 'Private' checkbox checked, only the creator will see that profile in the pop-up.
Profile Name
If a name entered already exists, a prompt pop-up will display, enabling changes to a saved profile.
Note: While a user can only create a forecast profile that includes locations within their Store Group only, they can access and create a forecast using any saved forecast profile, regardless of which stores are included (as long as the profile is not private).
Enter the 'Name' of a profile, and click the 'Save' button to save the profile. The profile saves the parameters from all of the tabs, 'Locations', 'Forecast Criteria, 'Sales Periods', and 'Automatic Updates'.
In order to save a profile, the profile must contain:
-
At least one line code selected.
-
The entry of 'Stocking Days' for at least one 'Sales Class 1' (zero is an acceptable value).
-
At least one sales period selected.
When saving a forecast profile, the application displays a progress prompt with the text: "Please Wait, Saving profile…".
If any of these parameters are missing, an error prompt is displayed:
When the 'Delete' button is clicked on the 'Profiles' pop-up, the following pop-up displays:
Load a saved profile by either clicking the 'Select' button with a profile selected in the list, or double-clicking the selected profile.
When a profile is selected, the application displays a progress prompt with the text: “Please Wait, Loading profile…'.
-
Profiles can be loaded to create a forecast using the same saved parameters.
-
If a forecast profile is loaded, and that profile contains settings which differ from those currently displayed, refresh the screen using the settings defined in the selected profile.
When the 'Forecast' button is clicked, and a profile exists with all required parameters, the application:
-
Shows a progress prompt with text: "Please Wait, Creating forecast…".
-
Closes the Create Forecast screen.
-
Shows the 'Open Forecasts' tab on the Forecasting Dashboard.
-
Calls the forecasting routine to start generating a new forecast. Note: After a few minutes, if the 'Reset' button is clicked on the Forecasting Dashboard, the new forecast will be displayed in the grid. The Forecasting Dashboard can also be closed and re-opened to see the new forecast.
When the 'Forecast' button is clicked on the Create Forecast screen, and the results of an open forecast already exists with the same profile name, the following pop-up displays:
When the forecasting routine has completed creating the new forecast, the application:
-
Logs a System Message that notifies the forecast was created.
-
Populates the 'Last Forecast Run Date' (on the Order / Cost screen) with the forecast create date for any parts included in the forecast (excluding virtual inventory).
-
Updates the stocking levels of parts in the forecast that match the 'Apply Updates To:' selection.
Once a new forecast is displayed in the grid on the Forecasting Dashboard, view the forecast results on the 'Forecast Detail' screen.
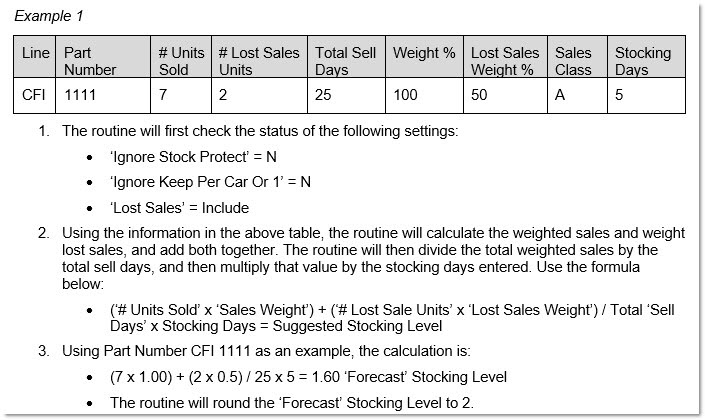
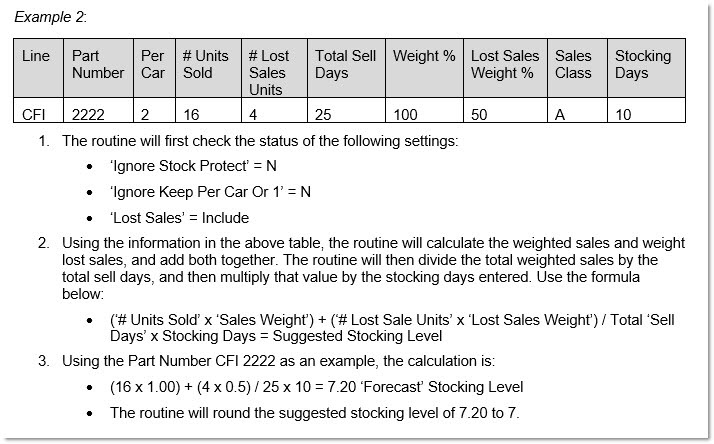
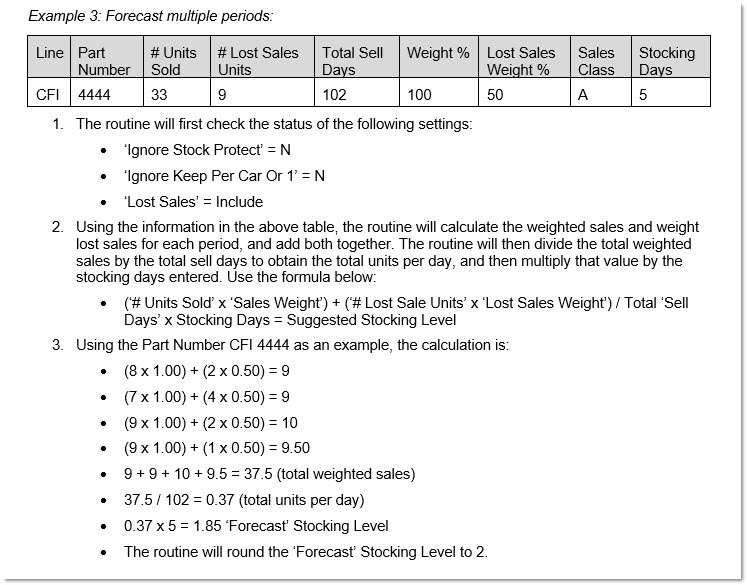
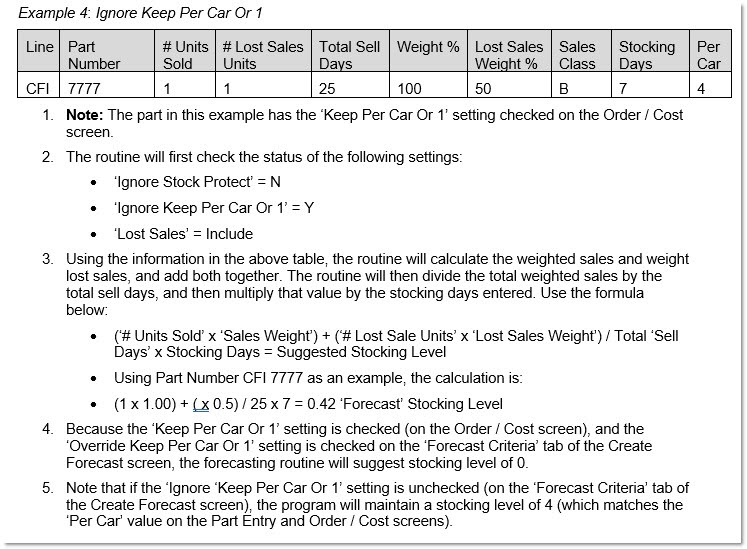
Forecast Calculation Examples
The following are examples of how the forecasting routine calculates stocking levels (using the default 'Round Up At:' value of 0.50).