Forecast Detail
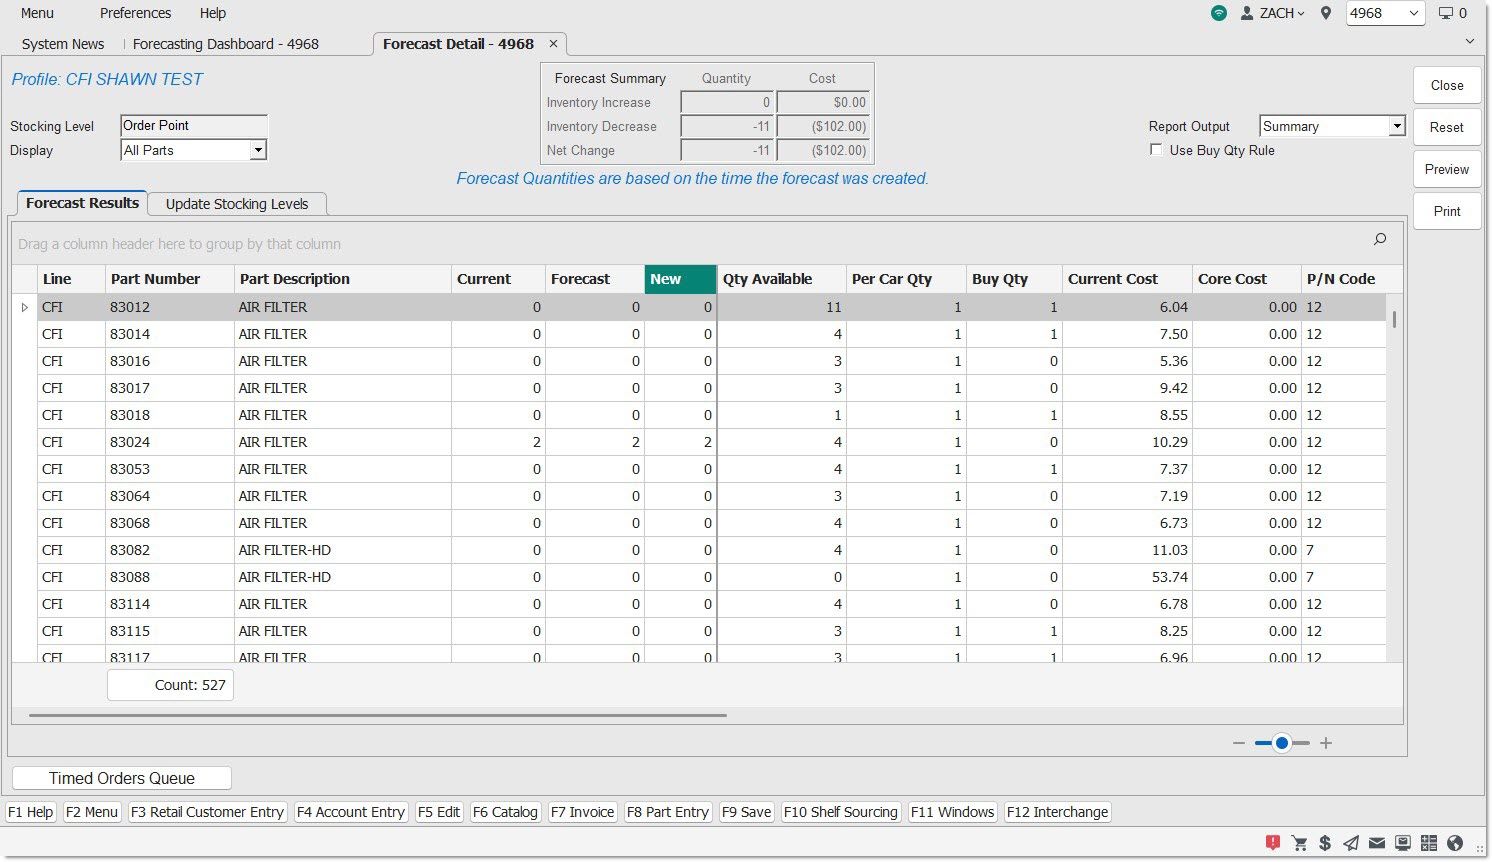
The Forecast Detail screen is used to view all of the setup and part inclusion information for a selected forecast.
Menu Path: Inventory, Forecasts, Forecasting Dashboard, 'Edit' / 'View' Forecast, Forecast Detail screen
Forecast Results Tab
Menu Path: Inventory, Forecasts, Forecasting Dashboard, 'Edit' / 'View' Forecast, Forecast Detail screen, 'Forecast Results' tab
The forecast "profile" is displayed in the top-right corner of the screen.
The text "Forecast Quantities are based on the time the forecast was created" is displayed above all tabs.
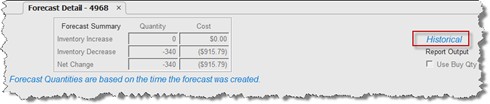
When viewing a historical forecast, the word 'Historical' is displayed in the upper-right corner of the screen, above 'Report Output'. Historical forecasts cannot be edited, they are read-only.
Stocking Level
Displays the 'Stocking Level' used to create the forecast.
Display
Drop-down that filters items in the grid, and compare the values in the 'Current' column against the values in the 'New' column.
-
'All Parts' (default) - Shows all items within the forecast, regardless if stocking level changes were suggested or not for every part item.
-
Note: If values in the 'New' column are edited, this can result in the part item being shown when another 'Display' filter drop-down option is selected.
-
-
'All Changes' - Shows all items in the forecast where there is a suggested stocking level change ('Current' is not equal to 'New').
-
'All Increases' - Shows all items in the forecast where there is a suggested stocking level increase ('Current' is less than 'New').
-
'All Decreases' - Shows all items in the forecast where there is a suggested stocking level decrease ('Current' is greater than 'New').
-
'All Changes From 0' - Shows all items in the forecast where there is a suggested stocking level increase from the current stocking level of '0' ('Current' = 0, 'New' > 0).
-
'All Changes To 0' - Shows all items in the forecast where there is a suggested stocking level decrease from the current stocking level to a value of '0' ('Current' > 0, 'New' = 0).
-
'Edits Only' - Shows only items in the forecast where edits have been made to the 'New' values.
-
'No Changes' - Shows all items where the forecast has no suggested changes to stocking levels ('Current' = 'New').
For open forecasts, the 'Display' default is 'All Parts', and for historical forecasts, the 'Display' default is 'All Changes'.
When a selection is made using the 'Display' drop-down and the PW Grid is to display a large number of rows, the application shows a "Please Wait" message.
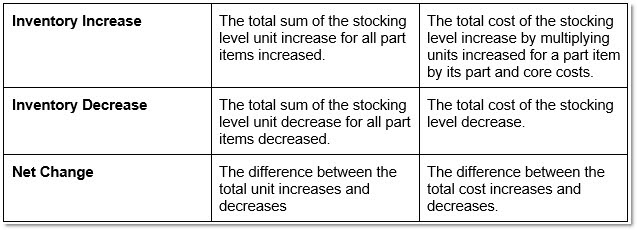
Forecast Summary
The 'Inventory Increase' and 'Inventory Decrease' totals calculates the difference between the 'Current' (stocking level) and 'New' (stocking level) units for each part item, and aggregates them together. The part cost values include part core values.
Forecast Summary
The 'Inventory Increase' and 'Inventory Decrease' totals calculates the difference between the 'Current' (stocking level) and 'New' (stocking level) units for each part item, and aggregates them together. The part cost values include part core values.
Any changes within the grid, as well as any changes to the 'Display' option selected in the top-left corner are reflected in the Forecast Summary.
Report Output
Drop-down that determines whether or not the 'Inventory Forecast Information Report' is run in the 'Summary' or 'Detail' version of the report, when run from this screen.
Use Buy Qty Rule
Checkbox that determines whether or not the forecasting routine rounds the suggested stocking level (in the 'New' column) up, using the Buy Quantity Rule value.
-
Checked - The forecasting routine rounds the suggested stocking level (in the 'New' column) up, using the Buy Quantity Rule value.
For example:
The forecasting routine calculates a new stocking level of 8 for a part item with a Buy Quantity Rule of 10. When the 'Use Buy Qty Rule' setting is checked, the 'New' value will be rounded up to 10 to meet the Buy Quantity Rule.
For the same part item, if the forecasting routine calculates a new stocking level of 12 and the 'Use Buy Qty Rule' setting is checked, the suggested stocking level will be rounded up to 20 to meet the Buy Quantity Rule.
-
Unchecked – The forecasting routine ignores applying the Buy Quantity Rule.
The setting is disabled for historical forecasts.
Important Note: Only the Universal Buy Quantity Rule (Supplier = blank) will be used by the forecasting routine when calculating stocking level suggestions.
Function Buttons
Close
Click to close the Forecast Detail screen and return to the Forecasting Dashboard screen.
Reset
Reset the screen back to the defaults and refreshes the PW Grid.
Preview
Click to generate a print preview of the forecast shown using the 'Report Output' selection.
Print
Click to print the forecast shown using the 'Report Output' selection, send to the default report printer.
Forecast Results Grid
A footer always displays for this grid, and displays a 'Count' value below the 'Part Number' column.
Location
Displays the location where the forecast was run, and only displays when the forecast is 'Multi-Location'.
Line
Displays the line code for the part item.
Part Number
Displays the part number for the part item.
Part Description
Displays the part's 'Description 1' for both stock and non-stock (virtual) inventory.
Current
Displays the current stocking levels (read-only) when the forecast started running.
This can only be a positive value or zero. All three columns reference the stocking level used to create the forecast. See the 'Stocking Level' field in the upper-left corner of the screen.
Forecast
Displays the suggested stocking levels (read-only).
This can only be a positive value or zero. All three columns reference the stocking level used to create the forecast. See the 'Stocking Level' field in the upper-left corner of the screen.
New
Displays the value copied from the 'Forecast' column (editable for Open Forecasts only) so if edits are made, the original suggested forecast can always be viewed.
This can only be a positive value or zero. All three columns reference the stocking level used to create the forecast. See the 'Stocking Level' field in the upper-left corner of the screen.
Qty Available
Displays the quantity available for the part item at the time the forecast was created.
Per Car Qty
Displays the "per car" quantity for the part item at the time the forecast was created.
Buy Qty
Displays the universal "Buy Quantity Rule" for the part item at the time the forecast was created.
Current Cost
Displays the current cost for the part item at the time the forecast was created.
Core Cost
Displays the core cost for the part item at the time the forecast was created.
P/N Code
Displays the P/N Code (subline) for the part item at the time the forecast was created.
Sales Class 1
Displays the 'Sales Class 1' value for the part item at the time the forecast was created.
Sales Class 2
Displays the 'Sales Class 2' value for the part item at the time the forecast was created.
Last Sold
Displays the date the part was last sold for the part item at the time the forecast was created.
# Units Sold
Displays the total number of units sold within the sales periods defined on the 'Sales Periods' tab of the Create Forecast screen. The value can be positive or negative.
# Lost Sales
Displays the total number of Lost Sales within the defined sales periods.
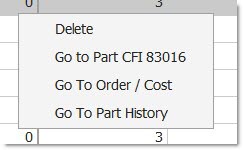
Forecast Results Grid - Right-Click Menu
Right-click on any row in the grid of an open forecast and the following right-click menu options display:
A mouse right-click on any row in the grid of a historical forecast will show the same options except 'Delete'.

Delete
This removes the part from the forecast. For a multi-location forecast, the part is removed from the forecast for all locations.
Multi-part 'Delete' can be performed by highlighting the first part row, holding the shift key, and clicking the last part row to delete. This will highlight all parts in the selection. Right-click anywhere in the section to select the 'Delete All' option.
Holding the 'Ctrl' key and selecting part rows with the mouse will also select individual part rows. Right-click anywhere in the section to select the 'Delete All' option.
Go To Part <Line> <Part>
Opens the Part Entry screen, and loads the selected Line and Part number.
Go To Order / Cost
Opens the Order / Cost screen, and loads the selected Line and Part number (as long as it isn't a non-SKU part).
Go To Part History
Opens the Part History screen, and loads the selected Line and Part number (as long as it isn't a non-SKU part).
Go To Buyers Guide
Shows the Buyers Guide per item. Only displays this option when the item is configured with a Buyers Guide.
Note: All 'Go To…' options will navigate to the screen in the location that created the forecast.
When a forecast is being loaded in the 'Forecast Results' tab, for any part items within the forecast that contains alternate parts (at the time the forecast was generated), the background color is set to orange for the 'Line' and 'Part Number' values.
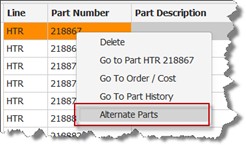
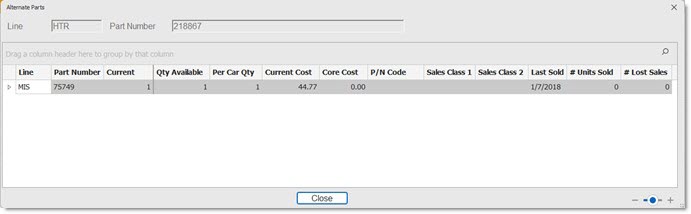
Alternate Parts
Click to display the 'Alternate Parts' pop-up, showing the same column order as displayed on the Forecast Detail screen (except: 'Forecast', 'New' and 'Buy Qty').
When a part is configured for decimal quantities, only the 'Qty Available' column displays decimal quantities at the time the forecast was created. The forecasting routine only calculates and displays whole values (no decimals) in the 'Current', 'Forecast' and 'New' columns.
Changes are made to new stocking level values of an open forecast by using the editable 'New' column. As changes are made, they are automatically updated in the database. Note: There is no 'Save' button that must be clicked.
When a change is made to a value in the 'New' column and the 'Enter' key is pressed, the cursor navigates to the next row below, staying in the 'New' column. When the last row is reached, the 'Enter' key stays in the bottom row.
Consolidated Results Tab
This tab optionally displays a consolidated view of each part included in a forecast created where more than one location has been included.
Menu Path: Inventory, Forecasts, Forecasting Dashboard, 'Edit' / 'View' Forecast, Forecast Detail screen, 'Consolidated Results' tab
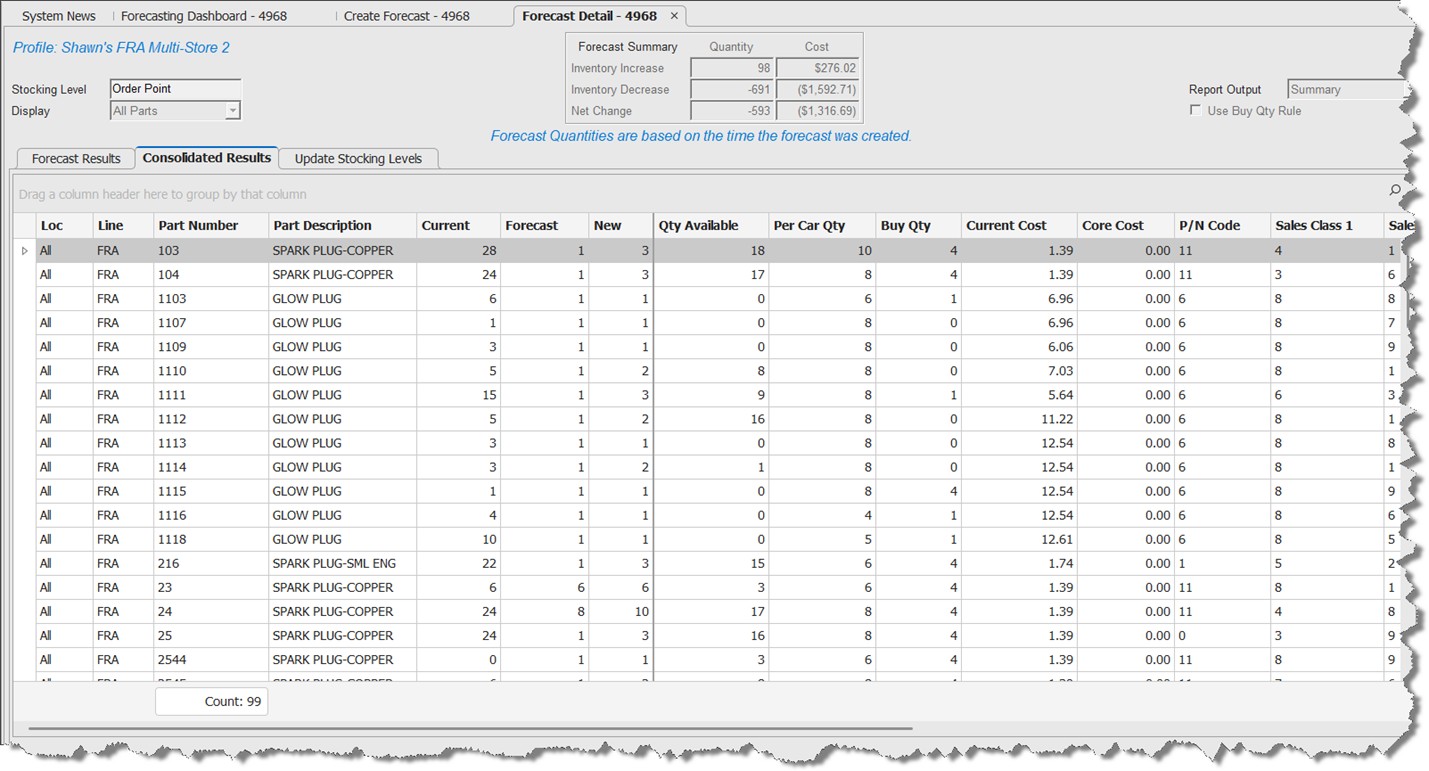
This tab is similar to the 'Forecast Results' tab, with some exceptions:
The 'Loc' column displays the text 'All'.
Forecast results aggregate all locations for each part item and displays a total value per row for the following columns:
-
'Current'
-
'Forecast'
-
'New'
-
'# Units Sold'
-
'# Lost Sales'
All other columns display values from the location that created the forecast (example: the 'Sales Class 1' column will display the 'Sales Class 1' value from the location that created the forecast for each part).
Alternate parts are not highlighted in this grid.
'New' column values cannot be edited for any part's consolidated results on this tab. Instead, as all edits are performed on the 'Forecast Results' tab, for any individual location's part included in the forecast, that edit is automatically edited in the 'New' column value on this tab.
The 'Consolidated Results' tab does not display for forecasts that have been moved to 'Historical'.
Update Stocking Results Tab
Once the forecast has been reviewed, the 'Update Stocking Levels' tab is used to manage stocking level updates, and optionally to create purchase or return orders (based on stocking level increases and/or decreases). The tab does not display for historical forecasts.
Menu Path: Inventory, Forecasts, Forecasting Dashboard, 'Edit' / 'View' Forecast, Forecast Detail screen, 'Update Stocking Levels' tab
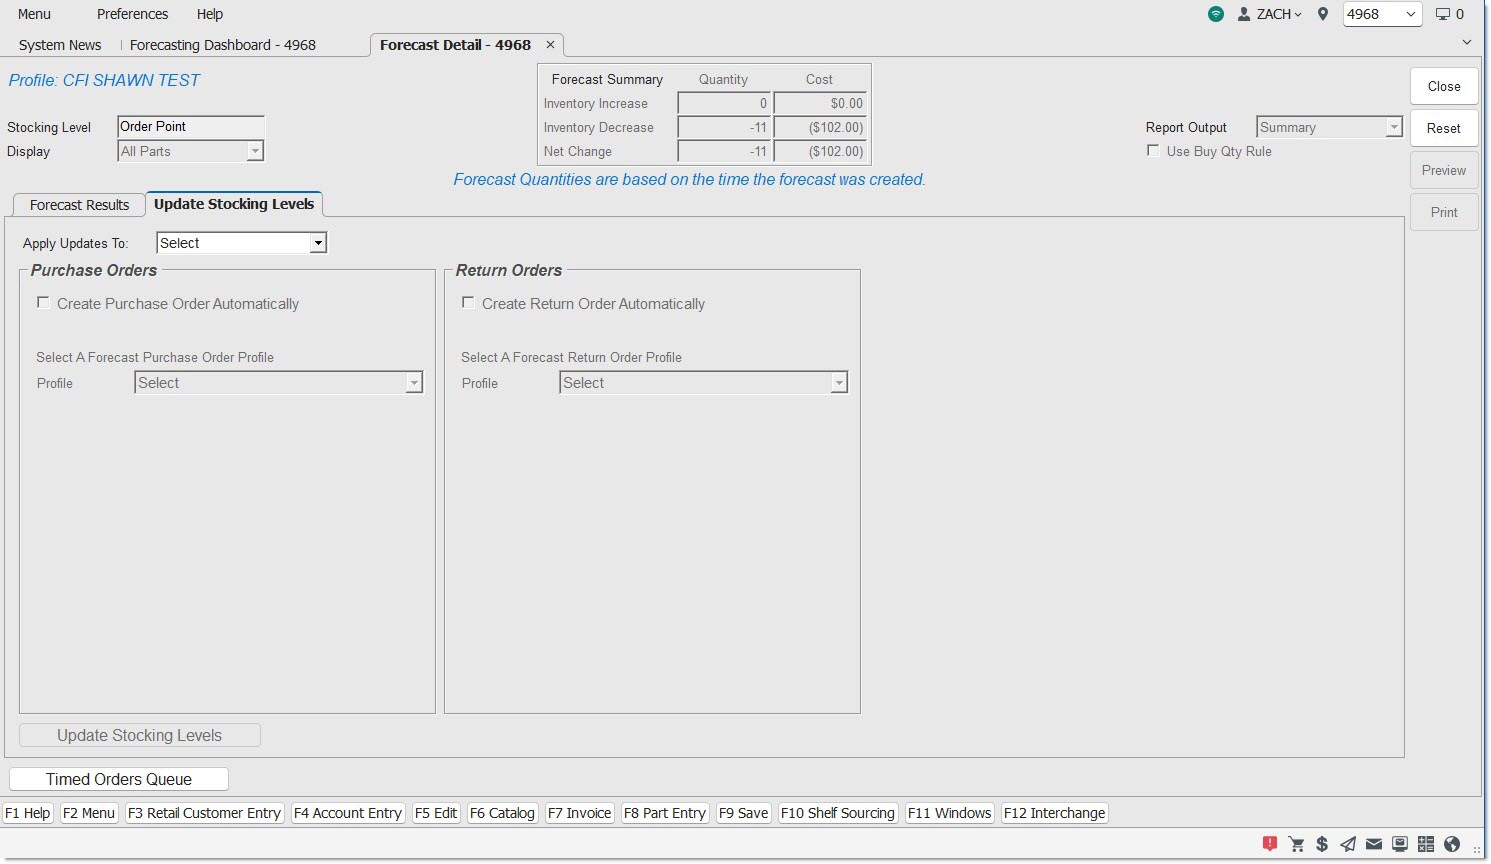
The 'Update Stocking Level' tab shows only for open forecasts.
When more than one location has been included in the forecast, the 'Profile' drop-downs are replaced with a grid (where a profile must be selected for each location to create the order).
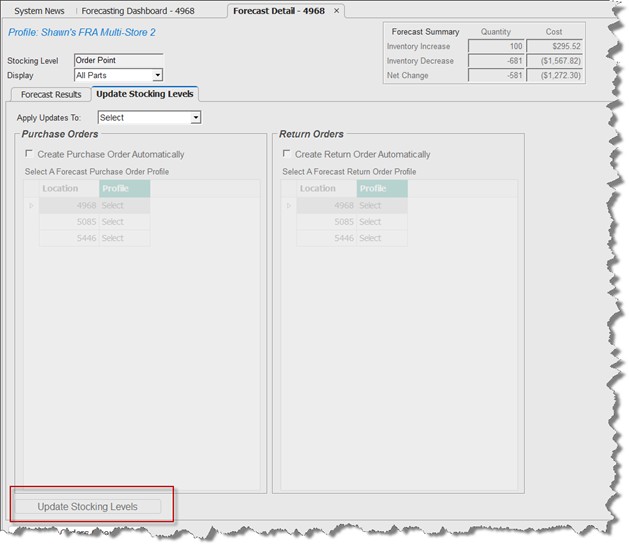
Create Purchase Order Automatically / Create Return Order Automatically
When either of these checkboxes are checked the forecasting routine compares the 'New' stocking level to the Quantity on Hand, and queues the PO process for any of the locations that have a purchase or return order profile selected.
-
Note that a stocking level change may not necessarily result in creating an order automatically, as the Quantity on Hand value is already higher than the forecast stocking level (for purchase orders), or lower than the forecast stocking level (for return orders).
-
An example is when the 'Create Purchase Order Automatically' checkbox is checked, and a forecast stocking level of 5 is updated to 10 for a part, but that part has a Quantity on Hand of 12, no purchase order will be created.
-
Another example is when the 'Create Return Order Automatically' checkbox is checked, and a forecast stocking level of 8 is updated to 4, but that part has a Quantity on Hand of 3, no return order will be created.
-
Apply Updates To
Drop-down that determines which part(s) to update:
Options are:
-
'Select' (default)
-
'All Changes':
-
Updates all stocking levels for items in the forecast to the 'New' values.
-
Closes the forecast (and make it Historical).
-
Replaces a previous historical forecast on the 'Historical Forecasts' tab of the Forecasting Dashboard with the one being updated.
-
-
'All Changes To 0':
-
Only updates items where the forecast calculates a stocking level change from a value greater than 0 to 0.
-
For items that do not qualify for 'All Changes To 0' updates, continues to display those items when the forecast is opened again.
-
-
'All Changes From 0':
-
Only updates items where the forecast calculates a stocking level change from a value of 0 to a value greater than 0.
-
For items that do not qualify for 'All Changes From 0' updates, continues to display those items when the forecast is opened again.
-
-
'All Increases':
-
Only updates items where the forecast calculates an increase to a stocking level (greater than the current stocking level).
-
For items that do not qualify for 'All Increases' updates, continues to display those items when the forecast is opened again.
-
-
'All Decreases':
-
Only updates items where the forecast calculates a decrease to a stocking level (less than the current stocking level).
-
For items that do not qualify for 'All Decreases' updates, continues to display those items when the forecast is opened again.
-
-
'Edits Only':
-
Only updates items where the user changed the value in the 'New' column on the 'Forecast Results' tab.
-
For items that do not qualify for 'Edits Only' updates, continues to display those items when the forecast is opened again.
-
The 'Update Stocking Levels' button is disabled until something other than 'Select' is chosen in the 'Apply Updates To' drop-down.
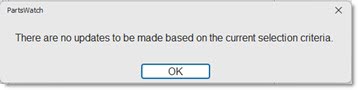
When the 'Update Stocking Levels' button is clicked, but there are no items in the forecast that match the option selected in the 'Apply Updates To:' drop-down, the application displays the following prompt:
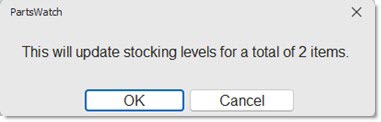
When the 'Update Stocking Levels' button is clicked, and the 'Create Purchase Order Automatically' or the 'Create Return Order Automatically' checkboxes are not checked, the application displays the following prompt:
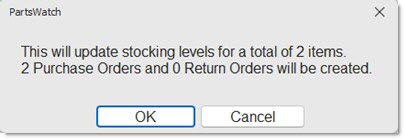
If the forecasting routine is to create a purchase order and / or a return order after all stocking levels have been updated, that information displays in the prompt.
The following prompt indicates a multi-location forecast. For each location, 1 item is being updated resulting in one purchase order being created in each location:
Click the 'OK' button and the application:
-
Closes the pop-up and the Forecast Detail screen.
-
Shows the progress message: "Please Wait, Updating stocking levels…"
-
Displays the 'Open Forecasts' tab on the Forecasting Dashboard.
-
Updates stocking levels (based on the 'Apply Updates To:' drop-down selection).
-
Creates the necessary purchase order and/or return order(s) (if either of the 'Create Purchase Order Automatically' or 'Create Return Order Automatically' settings are checked).
-
For any part updated where the stocking level is changed to a value different than the 'Current' stocking level value, populates the 'Last Forecast Change Date' field on the Order / Cost screen.
Click the 'Cancel' button and the application:
-
Closes the pop-up and continues to display the 'Update Stocking Levels' tab of the Forecast Detail screen.
-
Does not update stocking levels (or create orders).
Additionally, when a suggested stocking level is changing:
-
From a value greater than zero to zero, the application sets the 'Do Not Reorder' (DNR) checkbox to checked on the part item.
-
From a value of zero to a value greater than zero, the application sets the 'Do Not Reorder' (DNR) checkbox to unchecked on the part item.
Note: Since virtual inventory (non-SKU) parts do not have sales history or lost sales history, the forecast process qualifies virtual inventory (non-SKU) parts by Line, P/N Code and Sales Class. Consequently, without histories, the forecast results indicate that the stocking level should be zero (0). However, if there is a 'Per Car' quantity, the stocking level is set to the Per Car quantity, or based upon criteria settings the stocking level may be set to one (1). Virtual inventory parts (non-SKU) may be moved into the regular inventory (part table), unless other restrictions apply.