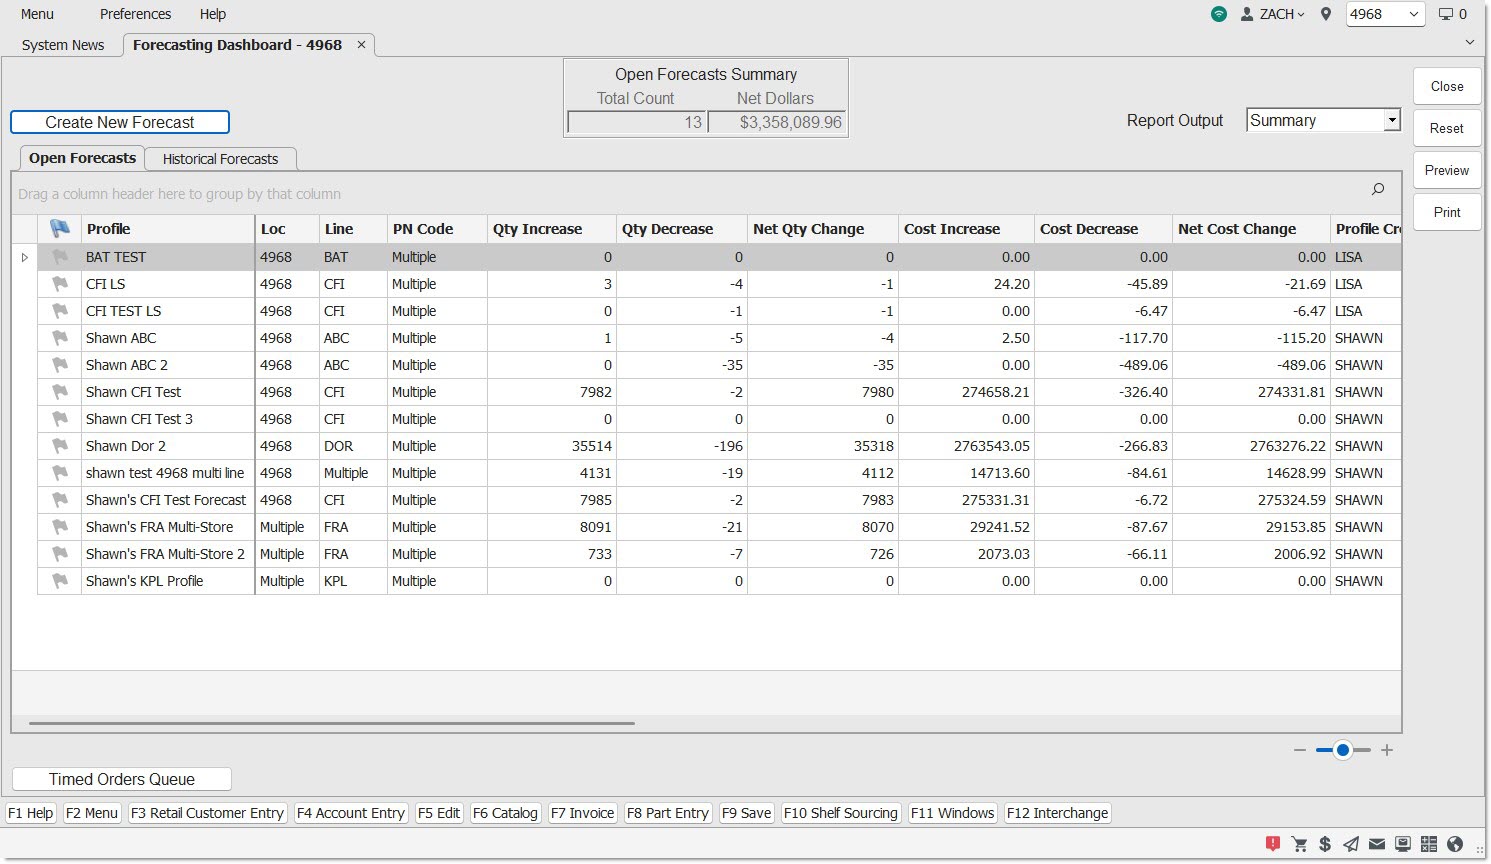
Forecasting Dashboard
Forecasting is used to calculate inventory stocking levels ('Min', 'Max', or 'Order Point') primarily based upon sales history units (and optionally lost sales units as well).
The Forecasting Dashboard for inventory has been introduced in PartsWatch in addition to the existing 'Set Min/Max' Utility. This new function requires the usage of part popularity codes ('Sales Class').
This new forecasting function:
-
Can be run on demand or scheduled to run on a periodic basis (e.g. weekly, monthly, etc.)
-
Includes options to forecast parts in multiple Locations, Lines, and PN Codes (Sublines).
-
Uses a PW Grid for reviewing forecast results. This grid enables easily sorting and filtering as well as saving the data results to a spreadsheet.
-
Allows reviewing results and making changes before updating stocking levels. For single-location forecasts only, can automatically update stocking levels after forecasts are calculated.
-
Allows options for which updates occur. For example, only update stocking levels to zero and set 'Do Not Reorder (DNR)' flag to 'Yes' for parts with zero sales units within a history period.
-
Allows creating the necessary purchase order and/or return order to send to suppliers.
Menu Path: Inventory, Forecasting Dashboard, Forecasting Dashboard screen
Glossary

Click to open the Create Forecast screen to create a new forecast. The hotkeys 'Alt' + 'N' act like the 'Create New Forecast' button. The button can be clicked multiple times.
Open Forecasts Summary/Historical Forecasts Summary
Shows a summary for the total count of the forecasts (open or historical) in the grid, along with the total net dollar value (aggregating all forecasted stocking level increases and decreases). When the 'Historical Forecasts' tab is clicked, the label switches to 'Historical Forecasts Summary'.
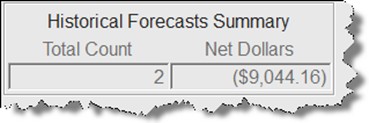
Note: Historical forecasts cannot be edited or deleted. These right-click menu options for historical forecasts are removed.
Note: Open forecasts can be deleted or edited via the right-click menu.
Report Output
Drop-down that determines how the report looks when the 'Print' or 'Preview' buttons are clicked, either a 'Summary' report or a 'Detail' report.
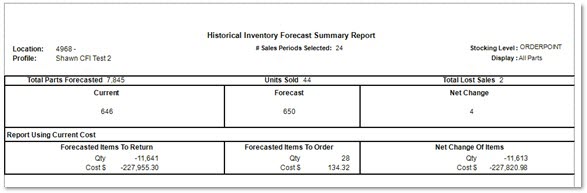
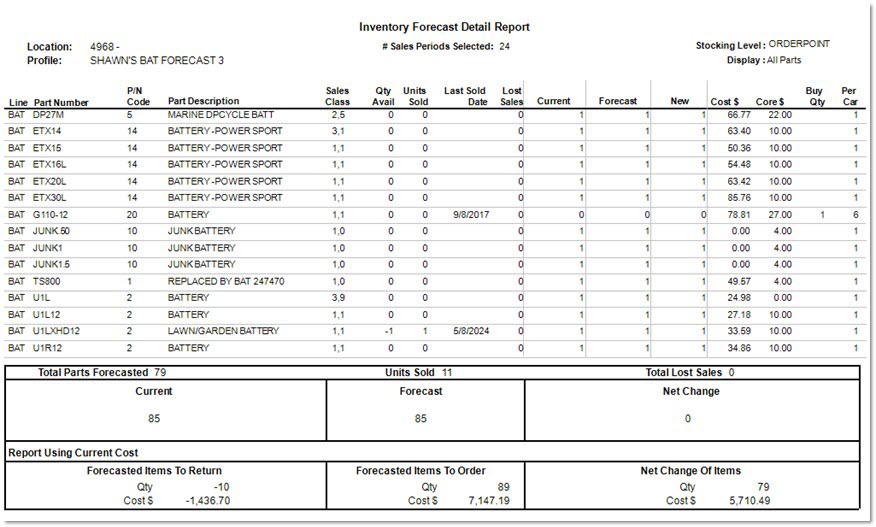
Forecasts Report
When the 'Print' or 'Preview' button is clicked, Forecast Report either displays as a print preview, or is sent to the default printer set up to print reports. The report can be run in either 'Summary' or 'Detail' mode. A historical version of the report only prints for a historical forecast.
Depending on the setups, the report can have one of four titles:
-
'Inventory Forecast Summary Report'
-
'Inventory Forecast Detail Report'
-
'Historical Inventory Forecast Summary Report'
-
'Historical Inventory Forecast Detail Report'
The header of the report contains the following:
Location
Displays the location number and name (if one exists). If more than one location was selected, the location numbers are included in the forecast.
Profile
Displays the name of the profile used to create the forecast.
# Sales Periods Selected
Displays all the sales periods selected for the forecast.
Stocking Level
Displays the stocking level used to create the forecast.
Display:
If the report is run from the Forecasting Dashboard, always displays 'All Parts'. If the report is run from the Forecast Detail screen, displays the option selected from the 'Display' drop-down.
Summary Report
Detail Report
Function Buttons
Close
Closes the Forecasting Dashboard screen.
Reset
Resets the screen to a just-opened state, and refreshes the grid displaying forecasts.
Preview
Creates a print preview to display based on the selection of the 'Report Output' drop-down. See the Forecasting Reports section for more details.
Print
Prints a report (to the printer set up as the default report printed) based on the selection of the 'Report Output' drop-down. See the Forecasting Reports section for more details.
Forecasting Dashboard Grid
Flag
Displays a flag symbol to flag individual forecasts for review/follow-up. Note: This column is frozen and is always visible on the screen, even after scrolling.
Profile
Displays the saved profile used to create the forecast. Note: This column is frozen and is always visible on the screen, even after scrolling.
Loc
Displays the location for the forecast. If the forecast was created for more than one location, displays 'Multiple'.
Line
Displays the line code used to create the forecast. If multiple line codes were selected, displays 'Multiple'.
PN Code
Displays the subline used to create the forecast. If multiple sublines were included, displays 'Multiple'.
Qty Increase
Displays the total quantity increases within the forecast. (This will always be a positive value.)
Qty Decrease
Displays the total quantity decreases within the forecast. (This will always be a negative value when < 0.)
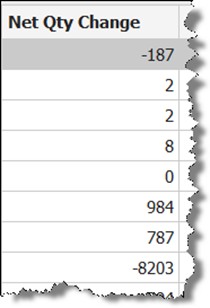
Net Qty Change
Displays the difference between the 'Qty Increase' and 'Qty Decrease' values (may be a positive or negative value.)
Cost Increase
Displays the total cost of the quantity increase, including any items with core values (will always be a positive value, unless zero).
Cost Decrease
Displays the total cost of the quantity decrease, including any items with core values (will always be a negative value, unless zero).
Net Cost Change
Displays the difference between the 'Cost Increase' and 'Cost Decrease' values (may be a positive or negative value). Note: All 'Cost' values will reference Current Cost.
Profile Created By
Displays the employee who created the forecast profile.
Profile Create Date/Time
Displays the date and time the forecast profile was created.
Forecast Start Date/Time
Displays the date and time the forecast process started. Note: Start and finish times can help assess forecast run durations with a lot of parts.
Forecast End Date/Time
Displays the date and time the forecast process ended. Note: Start and finish times can help assess forecast run durations with a lot of parts.
Forecast Run Duration
Displays the time it took for the forecast routine to run.
Forecast Results Last Updated
Displays the date and time the most recent edits were made to the forecast.
Forecast Historical Date/Time
Displays the date and time the 'Update Stocking Levels' button was clicked for 'All Changes'. Note: This column will only display information when viewing the 'Historical Forecasts' tab.