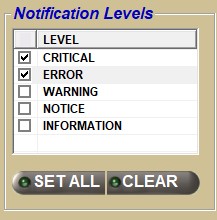
System Messages
Use the SYSTEM MESSAGES screen to view the results of changes to the application or the data in the application, such as statements printed, prices updated, orders transmitted and/or other changes or issues that may have occurred. This information can be helpful for Customer Support in helping to diagnose any issues.
Menu Path: Menu, Utility Options, System Messages, SYSTEM MESSAGES screen
System Message Filters
Change the value in this drop-down to change what messages display in the Messages Grid.
- 'ALL' - Select 'ALL' to display all messages, read or unread.
- 'READ' - Select 'READ' to display only the messages that have been clicked on and added to the upper grid display.
- 'UNREAD' (default) - Select 'UNREAD' to display only messages that have not been clicked on in the upper grid display.
Determines how messages are sorted.
- 'NEWEST' - Messages are sorted from the newest message (by entry date) to the oldest message.
- 'OLDEST' - Messages are sorted from the oldest message (by entry date) to the newest message.
Select a location to report by.
- 'ALL' - Select 'ALL' to output the 'SYSTEM MESSAGES' report by all locations in the environment.
- 'DEFAULT' - Select 'DEFAULT' to output the 'SYSTEM MESSAGES' report with all processes reported that are not store-specific.
- '[Current Location]' - (default) Select the current location to output the 'SYSTEM MESSAGES' report by the current location only.
Display-only field that reports the total number of messages for the selected screen filters.
Display-only field that reports the total number of unread messages (that have not been clicked on in the upper grid display) for the selected screen filters.
Message Source List
The message source list displays a list of folders that correspond to different functions within PartsWatch. Click a folder to see messages related to that source or process.
Message sources are:
- 'ALL'
- 'ASN'
- 'CLOSE'
- 'END OF DAY'
- 'INVENTORY'
- 'INVOICE'
- 'MODE2'
- 'PO XMIT'
- 'PRICE CHANGE'
- 'PRICE UPDATE'
- 'PURCHASING'
- 'SOURCING'
- 'TABLE LOCK'
- 'TASK SCHEDULER'
- 'MAIN FORECAST'
- 'OTHER' (displays messages not related to the existing sources)
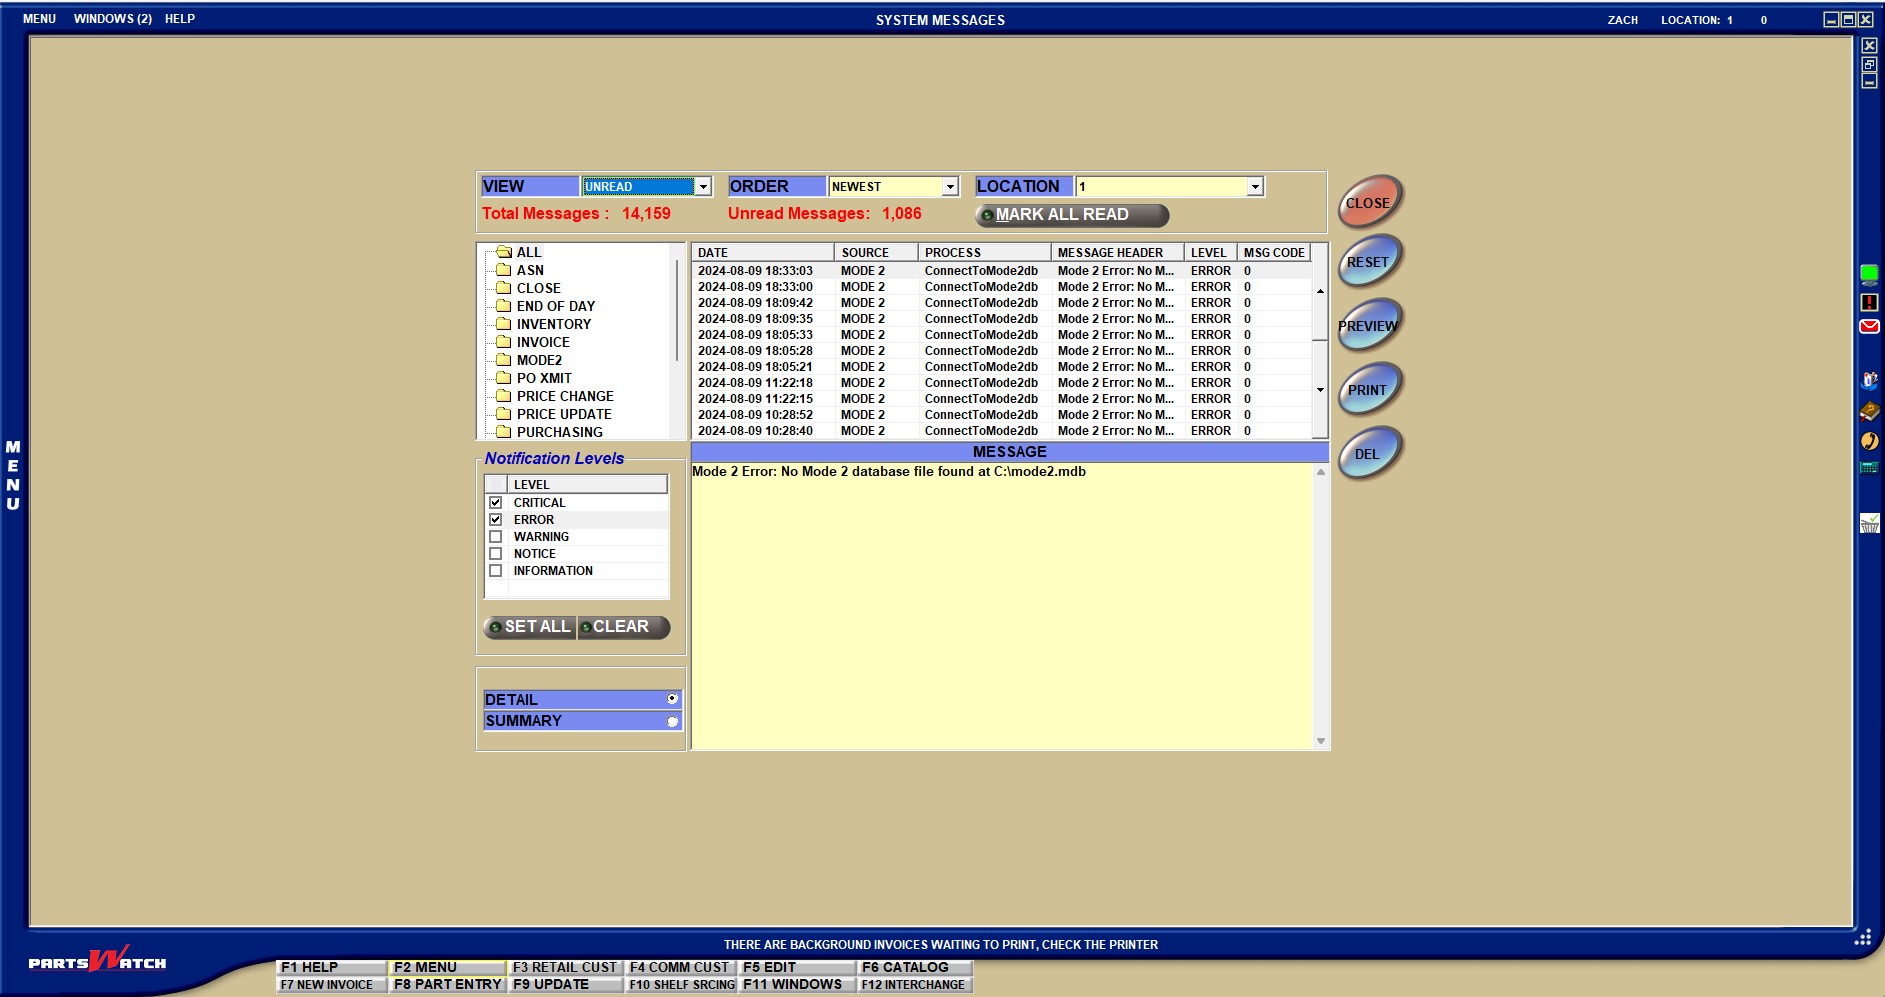
Message Grid
The message grid displays all messages based on the selected filters.
When a message is clicked in the top grid, it is marked as "read". The full message will display in the yellow text area below the grid, when selected.
Displays the date the message was entered into the table.
Displays the area of the application from where the messages originated, pulls from the Message Source List section.
Displays the application process that recorded the message.
Displays a brief header to describe the message.
Displays the 'Notification Level' of the message.
Displays the message code number used by the application.
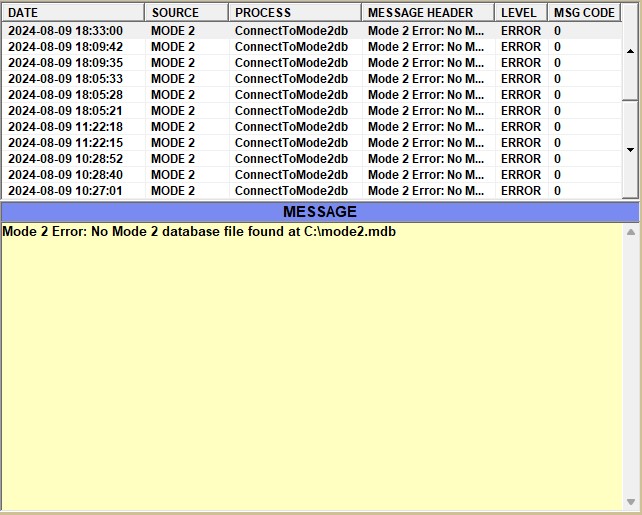
Notification Levels
The 'Notification Levels' section of the SYSTEM MESSAGES screen allows for the filtering of system messages by their severity level. Click the checkbox next to each severity to level to either display (checked) or hide (unchecked) messages labeled with that severity level.
Filters with which the display of messages based on the level of severity can be chosen.
Level options are:
- 'CRITICAL' - An error occurred that affects the entire enterprise, such as the Control Database is unavailable. (Checked by default)
- 'ERROR' - An error occurred that causes a single event or process to fail. (Checked by default)
- 'WARNING' - An error occurred that causes a single event or process to fail, but the event or process will be retried. Or, a condition occurred that is considered erroneous and was ignored, such as an ASN Part Supersede Notification was received for a part that has already been superseded by a different part.
- 'NOTICE' - An uncommon or extraordinary event occurred and was successfully handled, such as an ASN Part Supersede Notification caused the recording of a part supersedure.
- 'INFORMATION' - A common event or process occurred and succeeded.
Click the 'SET ALL' button to check all of the boxes next to every severity level in the 'Notification Levels' section. This will display all filtered messages with all severities in the Messages Grid.
Click the 'CLEAR' button to uncheck all the severity level checkboxes. This will remove all the messages from the Message Grid with severity levels.

User's System Message Window
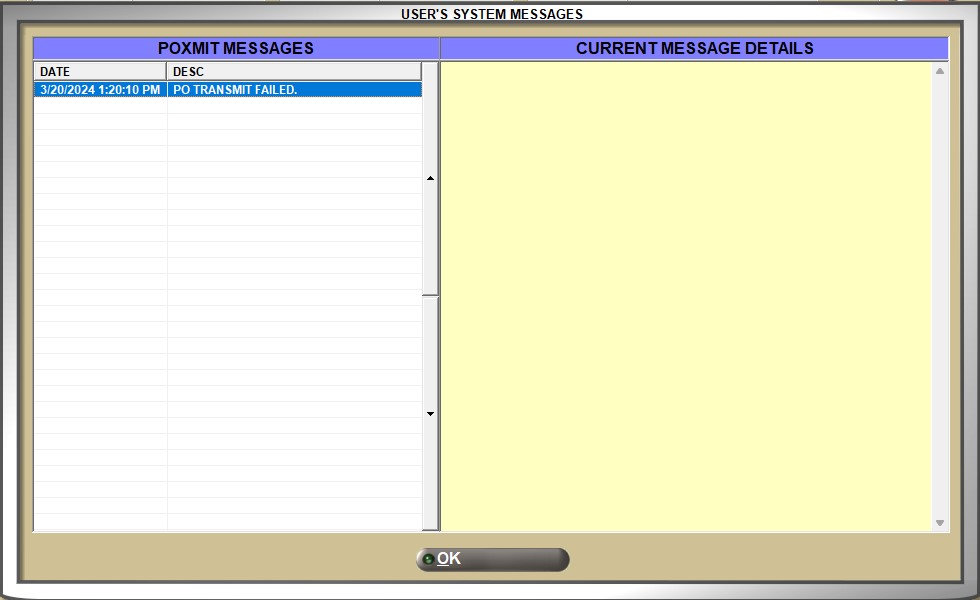
Click the envelope icon located in the right border of any application screen to access the 'USER'S SYSTEM MESSAGES WINDOW'.
When system messages are available for Inventory Management and Price Notification, the envelope icon in the screen border displays red. When any other type of message is available, the envelope icon displays in white.


The 'USER'S SYSTEM MESSAGES' window displays system messages applicable to the current user.
To display the current message details of a system message, double-click a message in the 'MESSAGES' grid, and the 'CURRENT MESSAGE DETAILS' grid populates.
The 'MESSAGES' grid displays the overview and list of messages from the system for the logged-in user. Click a message for more detail.
Displays the date and time the message was recorded by the system.
Displays a short description of the message.
Displays current status details related to the selected system message in the 'MESSAGES' grid. Displays the server date and time within the message details.
Forecasting
When the forecasting routine completes, and the creator of the forecast profile logs into the application, a notification is displayed (via the 'User System Messages' pop-up) that the forecast process has completed.
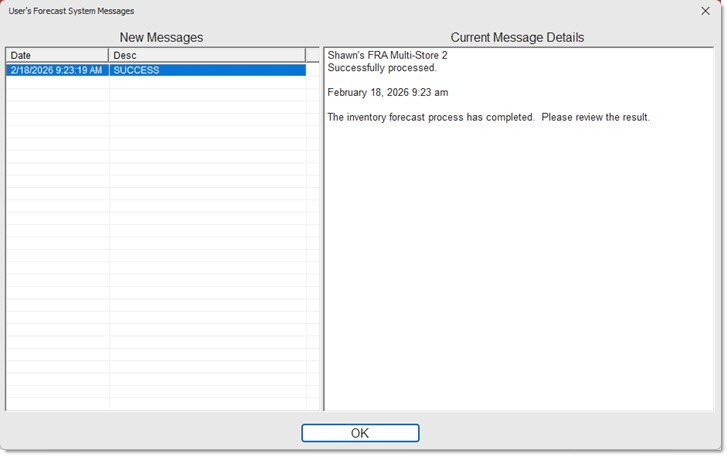
If the forecast was created successfully, but no parts were found for the forecast, a 'Success' message displays, and also displays in the message body that no parts were found to be forecasted.
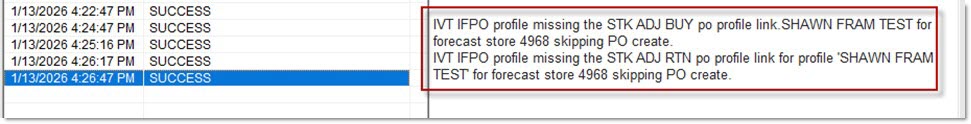
If a forecast was created successfully, but a purchase order or return order could not be created, show the details in the body of the message.
If the forecast was not created successfully, the application shows a 'Process Failed' in the message description, with further details as to why the forecast failed to create.
Note: The pop-up displays every time the creator of the forecast profile logs in, until the message is read (double-click on the new message in the grid to display the Current Message Details)
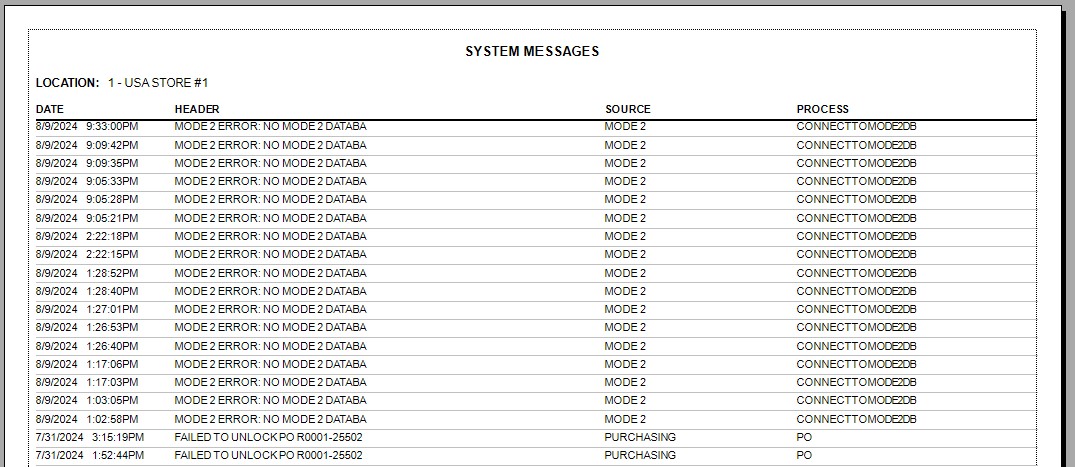
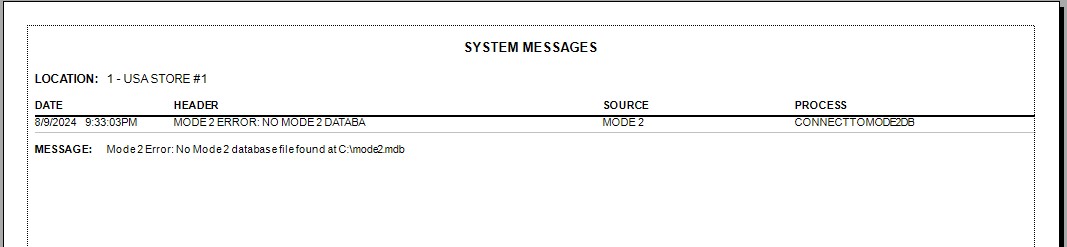
System Messages Report
Clicking the 'PRINT' or 'PREVIEW' buttons will output the System Messages Report with the same data as the Messages Grid and yellow detail area, depending on the values of the 'SUMMARY' and 'DETAIL' radio buttons. When the 'SUMMARY' radio button is checked, a summary of all of the system messages are output on the report. When 'DETAIL' is checked, the summary information and detailed message are output on the report.
Detail:
Summary: